Gaithersburg Market Stats
Gaithersburg, MD: Real Estate and Population Stats for Downsizers
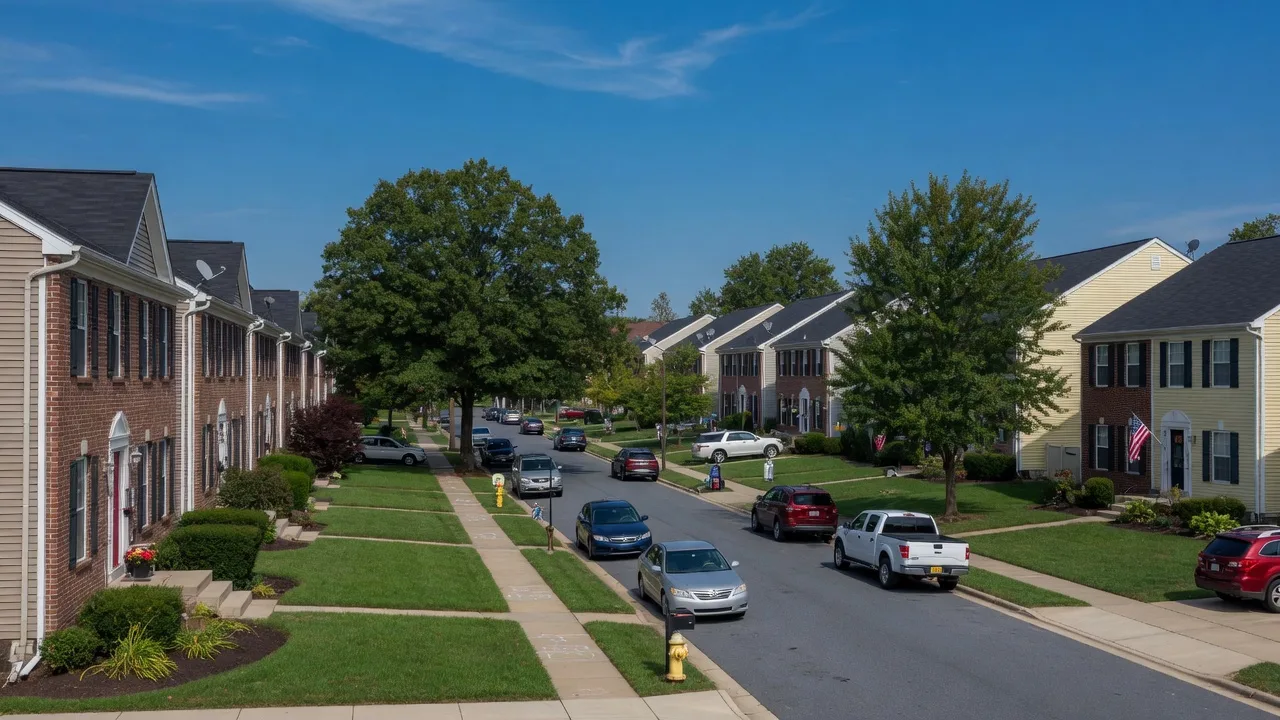
Gaithersburg is Montgomery County's second most populated city, with roughly 70,000 residents, a median age of 37.8, and about 1 in 7 residents 65 or older (Source: U.S. Census Bureau ACS, Redfin and Zillow; see sources below). The housing stock leans heavier toward condos and townhomes than most other Montgomery County towns, and the median home sale price sits in the mid-$500,000s as of mid-2026.
Quick Answer
Gaithersburg is Montgomery County's second most populated city, with roughly 70,000 residents, a median age of 37.8, and about 1 in 7 residents 65 or older (Source: U.S. Census Bureau ACS, Redfin and Zillow; see sources below). The housing stock leans heavier toward condos and townhomes than most other Montgomery County towns, and the median home sale price sits in the mid-$500,000s as of mid-2026.
Demographics
Population and Age
Population: 69,825 residents (U.S. Census Bureau, American Community Survey 5-Year Estimates, 2024 release). A separate 2026 projection from Cubit Planning puts the figure closer to 70,684 to 71,642, depending on the growth-rate model used.
Median age: 37.8 years (37.3 for men, 38.2 for women).
Seniors (65+): Estimates range from about 13.8% to 14.1% of the population depending on the data year, which works out to roughly 9,600 to 9,900 residents 65 or older. In plain terms, about 1 in 7 people in Gaithersburg is a senior.
Population change: Up about 0.6% since the 2020 Census (69,428 residents then), a slow, steady grind rather than a boom.
Source: U.S. Census Bureau ACS 5-Year Estimates (2024). Neilsberg Research population-by-age analysis of the same ACS dataset.
Income
Income
Median household income: $112,467.
Households led by someone 65 or older: Median income of roughly $103,946, lower than the citywide figure but still a strong number for a retirement-age household.
Poverty rate: 8.7% to 8.8%, depending on source year.
Source: U.S. Census Bureau ACS 5-Year Estimates (2024), as compiled by Point2Homes and Maryland-Demographics.com.
Housing Data
Housing Stock and Home Values
This is the number that matters most for a downsizing conversation, and it is also the number that moves fastest. Four different sources, pulled the same month, give four different figures:
| Source | Figure | Details | Why Different |
|---|---|---|---|
| Redfin | $545,000 (median sale) | 3 months ending May 2026, up 0.3% YoY. Avg 34 days on market. | Measures closed sale prices |
| Zillow | $494,924 (avg value) | Mid-2026, up 1.3% YoY. Typically pending in ~6 days. | Modeled valuation, all home types blended |
| Movoto | $525,000 (median list) | March 2026, median 19 days on site before contract. | Measures active list prices, not closed sales |
| Property Focus | $539,700 (median SFH) | July 2026, detached single-family homes only. | Isolates detached homes, excludes condos/townhomes |
Redfin
$545,000
Median sale price, 3 months ending May 2026
Closed sale prices. Avg 34 days on market, up 0.3% YoY.
Zillow
$494,924
Average home value, mid-2026
Modeled valuation, all types blended. Up 1.3% YoY.
Movoto
$525,000
Median list price, March 2026
Active list prices, not closed sales. 19 days on site median.
Property Focus
$539,700
Median detached single-family home, July 2026
Isolates SFH only, excludes condos and townhomes.
Why these do not match: Redfin and Movoto are measuring different things (closed sale price vs. active list price), Zillow's figure is a modeled valuation across all home types blended together, and Property Focus is isolating detached single-family homes only, which run higher than the townhome and condo inventory that makes up a large share of this market. None of these numbers is wrong. They are answering slightly different questions. For an exact number on a specific property, that requires a comparative market analysis, not a blended city-wide average.
Housing Types
By Housing Type
Rough current ranges:
- Condominiums: starting around $200,000
- Townhomes: roughly $400,000 to $650,000
- Detached single-family homes: median around $539,700 to $574,000. The average (mean) climbs higher, to $751,371, because a handful of larger, pricier sales pull that number up. Median is the more useful figure for a typical home.
Source: Fox Homes Team and Bright MLS IDX data. City-Data.com 2024 housing value compilation.
2024 Baseline for Context
| Metric | Value |
|---|---|
| Median house/condo value | $530,500 |
| Median value in 2000 | $154,900 |
| Median gross rent | $2,002/month |
Source: City-Data.com, compiling U.S. Census Bureau figures.
Analysis
What This Means for Downsizers
Gaithersburg's housing stock already leans toward attached homes (condos and townhomes) more than towns like Potomac or Silver Spring. That changes the downsizing conversation. A homeowner here is often moving from one attached or moderate-sized detached home into a smaller unit, not making the jump from a sprawling estate lot down to a condo. The math and the emotional adjustment are both smaller steps than in some other Montgomery County towns.
Trends
Market Trends to Watch
Gaithersburg's market is stable but not static. These are the indicators to track if you are planning a sale in the next 6 to 12 months:
- Inventory levels: Check current active listings vs. sold in the last 90 days. A rising inventory-to-sales ratio gives buyers more negotiating power. A tight inventory favors sellers. Gaithersburg has historically run on the tighter side, but that can shift quickly with new construction.
- Days on market: Monitor how quickly homes are selling. The current 34-day average (Redfin, May 2026) is a benchmark. If that number starts creeping above 45 days, pricing pressure shifts in the buyer's direction. If it drops below 20, expect multiple offers.
- Price reductions: Watch for price drops as a market signal. A cluster of reductions in a single neighborhood or price tier means sellers are overpricing relative to what buyers will pay. That is a useful signal when you are pricing your own home.
- New construction: Note any new developments that might affect competition. New condo and townhome projects in the Crown Farm and Kentlands areas add supply at the exact price point where many downsizers are buying. More supply at your target price means more competition for your sale.
Market data is directional, not predictive. These trends should inform your timing conversation with your agent, not replace it.
FAQ
Frequently Asked Questions
Is Gaithersburg a good market to sell in right now?
Based on the most recent data (Redfin, three months ending May 2026), Gaithersburg homes are selling at a median $545,000 after an average 34 days on market, with prices up slightly (0.3%) year over year. That is a healthy, stable market, not a frenzy and not a slump. Actual results depend heavily on the specific home's condition, location, and price point, so this citywide figure is a starting point, not a prediction for any one property.
How many seniors live in Gaithersburg?
Roughly 13.8% to 14.1% of Gaithersburg's population is 65 or older, based on the latest Census Bureau American Community Survey estimates. That works out to somewhere between 9,600 and 9,900 residents.
Resources
Related Resources
Downsizing in Gaithersburg
Main Gaithersburg downsizing guide — local housing stock, where residents move next, and what sellers 50+ should know.
Best Neighborhoods for Downsizing in Montgomery County
An honest comparison of Leisure World, Rockville, Kentlands (Gaithersburg), Bethesda, and Silver Spring for downsizers.
Downsizing Cost Calculator
Run the numbers on your current mortgage, estimated sale price, and costs to see your real range.
55+ Communities Comparison Guide
Compare 55+ communities in Montgomery County, including pricing, amenities, and lifestyle.
Your Gaithersburg Guide
Marc Cormier, Seniors Real Estate Specialist
Seniors Real Estate Specialist (SRES) serving Gaithersburg and Montgomery County. Whether you need market data, a valuation, or a plan for selling and downsizing, Marc can help you make sense of the numbers and build a strategy that fits your goals.
Seniors Real Estate Specialist (SRES) · Residential Construction Certified (RCC)
Berkshire Hathaway HomeServices PenFed Realty · Licensed in Maryland (#620443)
Top 1% of Realtors Nationwide
Ready to Talk?
Talk With Marc
Not sure whether to fix up your Gaithersburg home, sell as-is, or what comes next? Start with a conversation. Marc will listen to your situation and give you an honest picture of what is possible, no obligation.
Sources & Disclaimer
Sources: U.S. Census Bureau American Community Survey 5-Year Estimates (2024), Redfin Housing Market Data (May 2026), Zillow Home Value Index (2026), Movoto Market Trends (March 2026), Property Focus County Records (July 2026), and City-Data.com. Figures current as of publish date and should be refreshed quarterly. This page reports market data. It is not a valuation of any specific property.
Start the Conversation
Have a Question About Gaithersburg Market Stats?
Whether you are weighing the right time to sell or just want to understand the numbers, Marc can help. Tell him about your home and your timeline.
Sorry, we couldn't reach our system. Your details were not sent. Please try again in a moment.
Thank you.
I will be in touch shortly to discuss your downsizing goals.
Something went wrong. Please try again or call me directly at (301) 660-6272.